Accidents

When managing a fleet, accidents are inevitable. Tracking accidents is crucial for understanding vehicle maintenance costs and identifying safe drivers.

Odoo’s Fleet app offers multiple ways to track accidents. Below are step-by-step instructions for only one method to monitor accidents and repair costs.

结构

For this example, to track accidents, two service types are created: Accident - Driver's Fault and Accident - No Fault.

This tracks various repairs associated with accidents, organized by who was at fault.

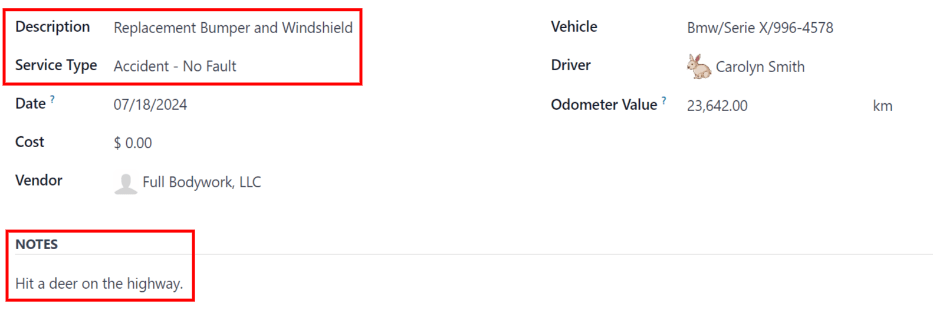
When an accident occurs, a service record is created. The specific repairs needed for the accident are logged in the Description of the service record, and the details about the accident are logged in the Notes section.

With this organizational structure, it is possible to view all accidents organized by fault, car, driver, or cost.

注解

To manage accidents, the creation of service records is required.

Refer to the 服务 documentation for detailed instructions on creating service records in Odoo’s Fleet app.

Log accidents and repairs

To log an accident, and initiate the repair process, the first step is to create a service record detailing the specific repairs needed.

注解

Some accidents require multiple repairs with several different vendors. For these scenarios, a separate service record is needed for each vendor performing repairs. To keep records organized, it is recommended to keep the Notes field identical, as well as attaching the same important documentation, such as a police report.

Navigate to Fleet app ‣ Fleet ‣ Services to view the main Services dashboard. Click New in the top-left corner, and a blank service form loads.

输入新规则的信息。

  • Description: enter the description of repairs needed to fully repair the vehicle, such as Bodywork, Windshield Replacement, or Replacement Bumper, Tires, and Windows.

  • Service Type: for this example, select either Accident - Driver's Fault or Accident - No Fault, depending on the situation.

    When entering either of these two Service Types for the first time, type in the new service type, then click Create (new service type). A Create Service Type pop-up window appears, with the new service type populating the Name field. In the Category field, select Service from the drop-down menu, then click the Save & Close button.

    Once an accident service type has been added to the database, it is available to select from the drop-down menu in the Service Type field.

  • Date: using the calendar popover window, select the date the accident occurred. Navigate to the desired month using the (arrow) icons, then click the date to select it.

  • Cost: leave this field blank, as the repair cost is not yet known.

  • Vendor: select the vendor performing the repairs using the drop-down menu. If the vendor has not already been entered in the system, type in the vendor name, and click either Create to add them, or Create and edit… to add and configure the vendor.

  • Vehicle: select the vehicle that was in the accident from the drop-down menu. When the vehicle is selected, the Driver field is populated, and the unit of measure for the Odometer Value field appears.

  • Driver: the current driver listed for the selected vehicle populates this field when the Vehicle is selected. If a different driver was operating the vehicle when the accident occurred, select the correct driver from the drop-down menu.

  • Odometer Value: enter the odometer reading when the accident occurred. The units of measure are either in kilometers (km) or miles (mi), depending on how the selected vehicle was configured.

  • NOTES: enter the specific details of the accident at the bottom of the service form, such as Hit a deer or Rear-ended at an intersection while stopped.

Odoo provides the ability to attach any important paperwork, such as repair estimates and police reports, to the service record. To do so, click the (paperclip) icon, located in the chatter of the form, and a file explorer pop-up window appears. Navigate to the desired record, and click Open to upload the file.

注解

Once a file is added to a service record, a Files section appears in the chatter. To attach more records, click Attach files to add more documents.

Enter the information for an accident repair.

Service stages

In Odoo’s Fleet app, there are four default service stages:

The default stage when a service record is created. The service has been requested, but repairs have not begun. The Cost field for this stage remains zero.

During the repair process, change the service status to reflect the vehicle’s current state in one of two ways: on the individual service record, or in the Kanban service view.

Service record

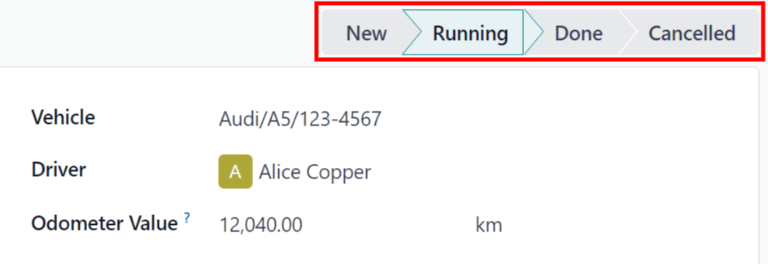
Open the main Services dashboard, by navigating to Fleet app ‣ Fleet ‣ Services. Next, click on the individual service record to open the detailed service form. Click the desired stage in the top-right corner, above the service form, to change the status.

The stages as seen from the service form.

看板视图

Open the main Services dashboard, by navigating to Fleet app ‣ Fleet ‣ Services. First, click the Kanban icon in the top-right of the screen, which organizes all repairs by vehicle.

Next, remove the default Service Type filter in the search bar. Upon doing so, all services appear in a Kanban view, organized by their respective Status.

Drag-and-drop the service record to the desired stage.

The Kanban view of stages, with a card being dragged and dropped to the Running stage.

Accident reporting

One of the main reasons to track accidents using the method outlined in this document is the ability to view the total accident cost, determine the safest drivers, and calculate the actual total cost for specific vehicles.

The main Services dashboard displays all the various accident information, while the Reporting dashboard displays the total cost for specific vehicles.

Services dashboard

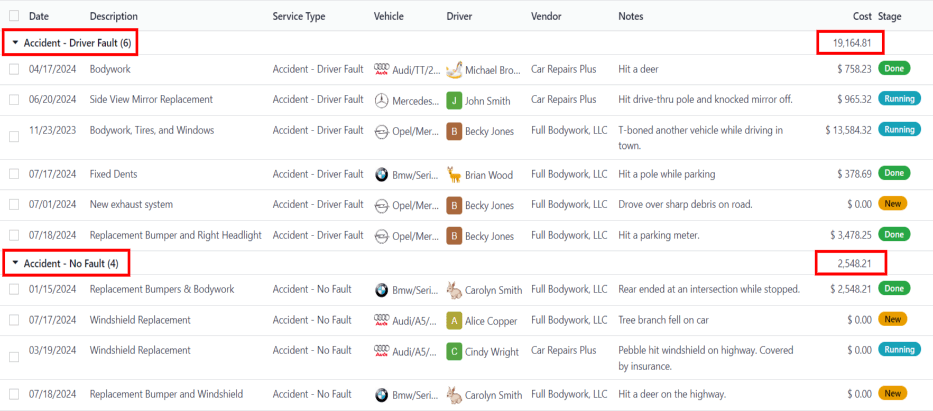
Navigate to Fleet app ‣ Fleet ‣ Services to view the Services dashboard. All service records are displayed in a (List) view, grouped alphabetically, by Service Type.

The two service types created for accident tracking appear in the list: Accident - Driver Fault and Accident - No Fault.

Each grouping displays the number of records within each type, and lists the individual records beneath each grouping title.

Example

In this example, there are six accidents where the driver was at fault, and four accidents that were not the driver’s fault. This dashboard also displays the estimated total Cost for all the accidents in each group.

An estimated $19,164.81 dollars are for driver-caused accident repairs, and an estimated $2,548.21 dollars are for no-fault accidents.

Accident services, with the total costs highlighted.

注解

The total Cost calculates all costs on the repair form, including estimated costs, as well as final repair costs. This number may not be accurate, if there are any repairs in the Running stage, and the final bill has not yet been calculated.

Reporting dashboard

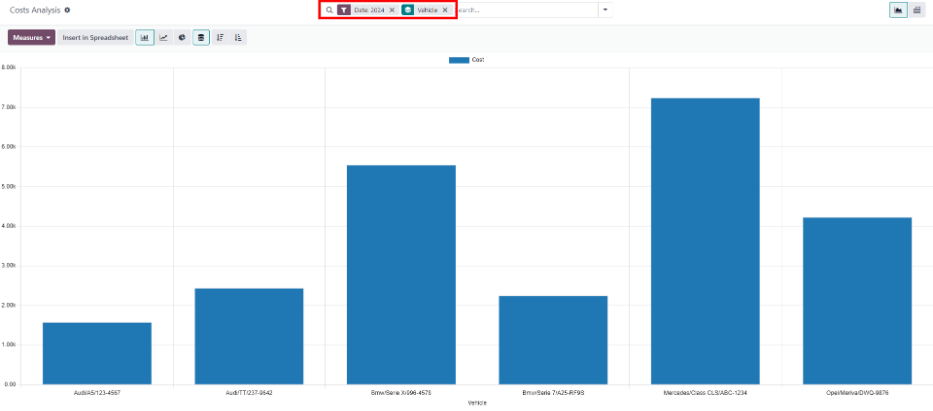
Navigate to Fleet app ‣ Reporting ‣ Costs to view the Cost Analysis report. This report displays a (Bar Chart) of all Contract and Service costs for the current year, organized by month (Date : (year)), by default. The Sum, represented by a gray dotted line, is the combined total of both the Contract and Service costs.

To view the total cost by vehicle, click the (down arrow) icon at the right of the search bar, revealing a drop-down menu. Click Vehicle in the Group By column, and the data is organized by vehicle.

This displays the true cost for each vehicle, including both the contract cost (such as the monthly vehicle lease cost) and all service costs, including all accidents. Hover over a column to reveal a data popover window, which displays the vehicle name and the total cost. This allows for a more complete view of the vehicle cost.

The Cost Analysis report, displaying total costs by vehicle.

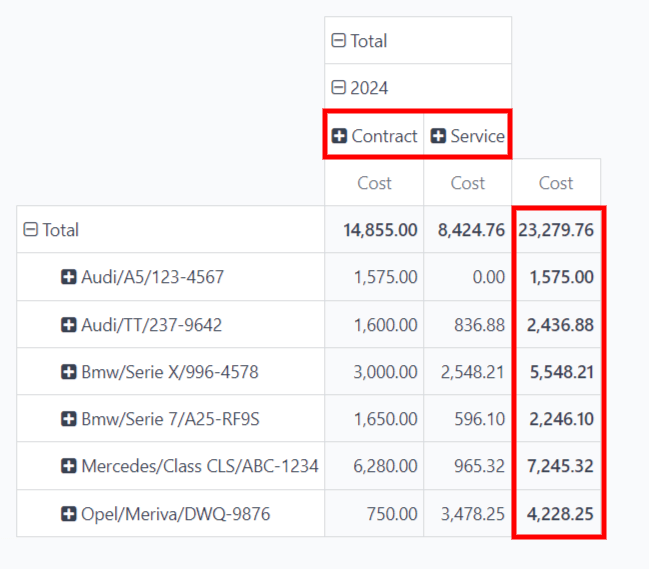
To view the individual cost details for both contract costs and repairs, click the (Pivot) icon in the top-right corner of the Cost Analysis dashboard. This displays each vehicle on a separate line, and displays the Contract cost and Service cost, as well as the Total cost.

The Cost Analysis report, displaying the contract and service costs separately, as well as the total.

注解

The (Pivot) view organizes the data by vehicle, by default, therefore grouping the data by Vehicle is not required. If this filer is already activated, it does not affect the presented data.

Manage accident repairs

For companies with multiple employees, who manage a large fleet of vehicles, displaying only service records in the New and Running stages can be time-saving, if there are a large number of records in the Services dashboard.

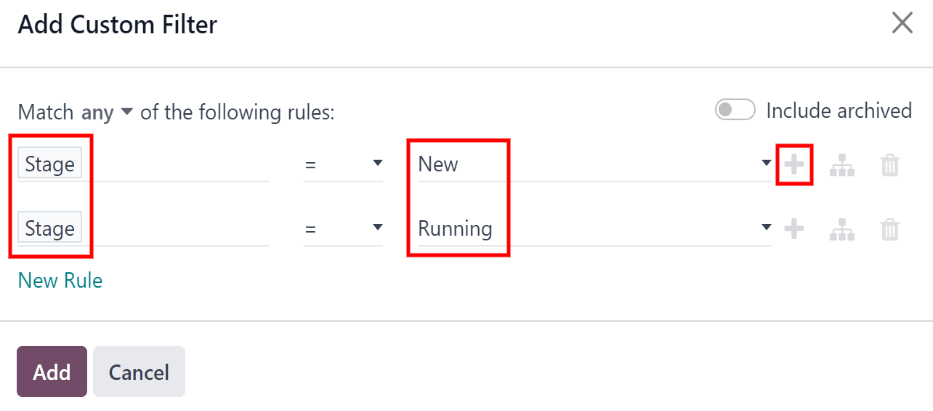
Navigate to Fleet app ‣ Fleet ‣ Services, where all service requests are organized by Service Type. Next, click the (down arrow) icon at the right of the search bar, revealing a drop-down menu. Click Add Custom Filter in the Filters column, and a Add Custom Filter pop-up window appears.

Three drop-down fields need to be configured on the pop-up window.

In the first field, scroll down, and select Stage.

Leave the second field set to =.

Select Running from the drop-down menu in the last field.

Next, click the (plus) icon to the right of the last field, and an identical rule appears beneath the current rule.

Then, change Running to New in the third field of the second rule, leaving the other fields as-is.

Click the Add button at the bottom to add the new custom filter.

The filter settings to be added to only display new and running services.

This slight modification only presents services in the New and Running stages. This is a helpful report for a company managing a high number of repairs at any given time.

To have this report appear as the default report when opening the Services dashboard, click the (down arrow) icon at the far-right of the search bar. Next, click Save current search, beneath the Favorites column, which reveals another drop-down column beneath it. Tick the checkbox beside Default Filter, then click Save. Then, this customized Services dashboard appears, by default, anytime the Services dashboard is accessed.