Survey analysis
After surveys have been created and sent to participants, it is only a matter of time before the responses start to come in. When they do, it is important to know where and how to analyze them in the Odoo Surveys application.
Fortunately, Odoo provides numerous ways to view survey responses, allowing users to access and analyze survey responses as they are submitted.
查看结果
Upon opening the
application, the main dashboard reveals a list of all the surveys in the database, along with pertinent information related to each one.By default, every survey line showcases its number of Questions, Average Duration, and how many participants have Registered or Completed the survey.
There are also elements showing the percentage of how many participants Passed (if a Required Score (%) was configured), or how many participants became Certified (if the Is a Certification option was configured).
注解
To learn more about the different analytical elements found on the Surveys dashboard, check out the Survey Essentials documentation.
On the Surveys dashboard, to the far-right of each survey line displayed in the default list view, there is a See results button.
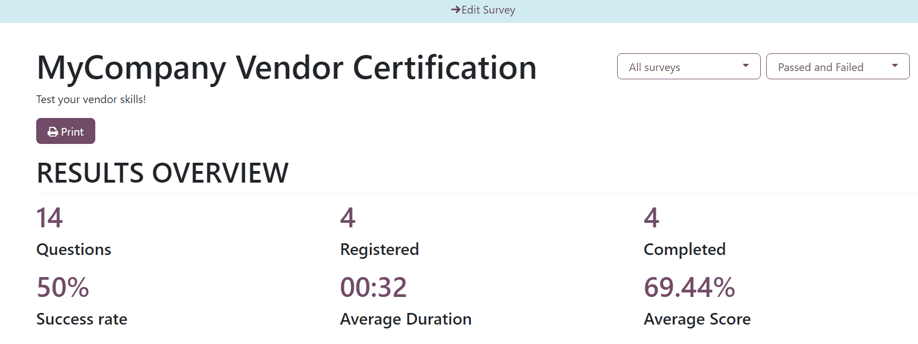
When the See results button is clicked, a new browser tab opens, revealing a separate page filled with all of that particular survey’s results and responses, with an informative Results Overview and some filtering drop-down menus at the top.
At the top of the page, there is an Edit Survey link, in the middle of a blue header banner. When clicked, Odoo returns the user to the survey form for that particular survey.
Beneath that, is the title of the survey, and its description, if one was configured for it on its survey form.
To the right of the survey title, there are two drop-down menus with various filtering options, which can be used to personalize and segment the survey results in a number of different ways.
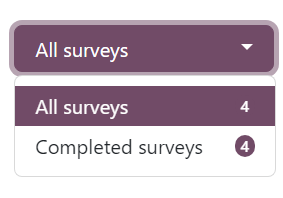
The first filter drop-down menu is set on the default All Surveys option, meaning the results below are showing results and responses from all the submitted surveys, regardless if they have been fully completed or not.
When that drop-down menu is clicked open, another option, Completed surveys, appears.
With that drop-down menu open, the number corresponding to each filter option appears to the right of each option.
To the right of that drop-down menu of filter options, is another drop-down menu of filter options that can be used to further customize the results showcased on this page.
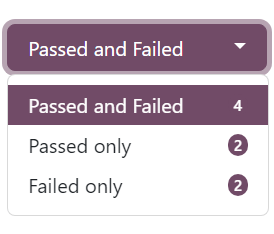
That drop-down menu is set to the Passed and Failed option, by default. This option shows the results and responses from all participants who have passed or failed this particular survey.
注解
This second drop-down menu of filter options only appears if the survey being analyzed has a Scoring option configured, or if the Is a Certification feature has been enabled.
When that second drop-down menu of filter options is clicked open, two additional options appear: Passed only and Failed only.
Each option would filter the results below to only show responses from participants who have passed the survey, or who have failed the survey, respectively.
Directly beneath the survey title, there is a Print button. When clicked, the entire results page can be printed.
The Results Overview section is below the survey title, filter option drop-down menus, and Print button.
This section of the results page provides a summarized collection of useful survey-related data and metrics for quick analysis.
Question analysis
Directly beneath the Results Overview section is where the results and responses of the survey are found.
注解
The various sections of the survey, if there were any, appear at the top of their corresponding questions on the results page, as well, for added organization.
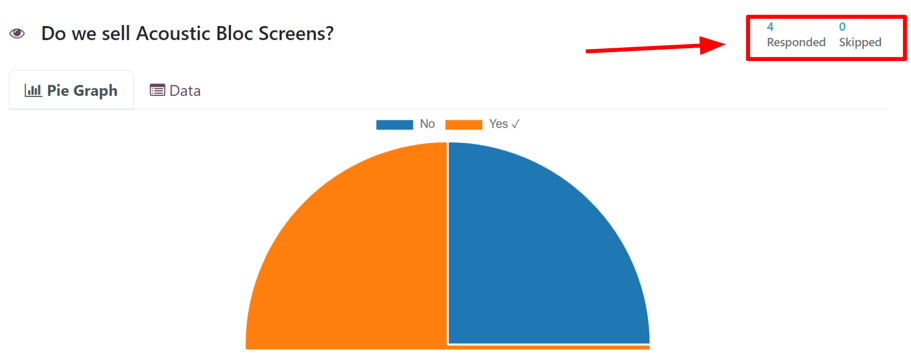
Every question that was a part of the survey is shown, along with an in-depth breakdown, and visual representation, of how it was answered by participants, beneath the Results Overview section.
Each question is displayed above its corresponding results. To the left of the question is an 👁️ (eye) icon. When clicked, Odoo hides the visual and data-related results and responses. When clicked again, that question’s visual and data-related results re-appear.
To the far-right of the question, there are indicators to see how many participants Responded and how many Skipped the question.
If the question required the participant to enter in their own answer, without any options to choose from, like entering a specific number or date, for example, there is also an indicator to showcase how many users answered the question Correct.
注解
Even if there is no configured correct response for question of this nature, the
Correct indicator still appears, although, it displays a 0
.
This would occur for opinion-based questions, like When would be a good time to hold another
sale?
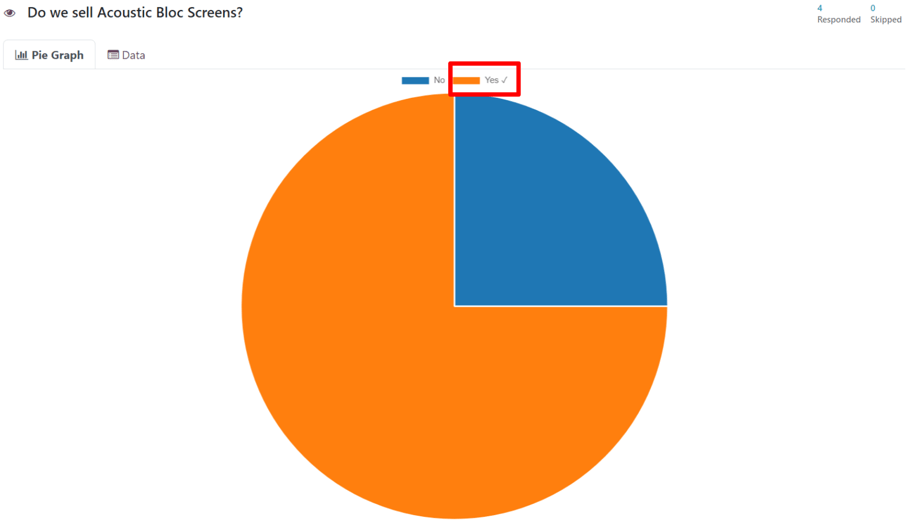
If there is only one correct response to a multiple choice question, those results and responses are represented by a Pie Graph. The correct answer is indicated by a ✔️ (checkmark) icon next to the correct answer option, in the legend above the graph.
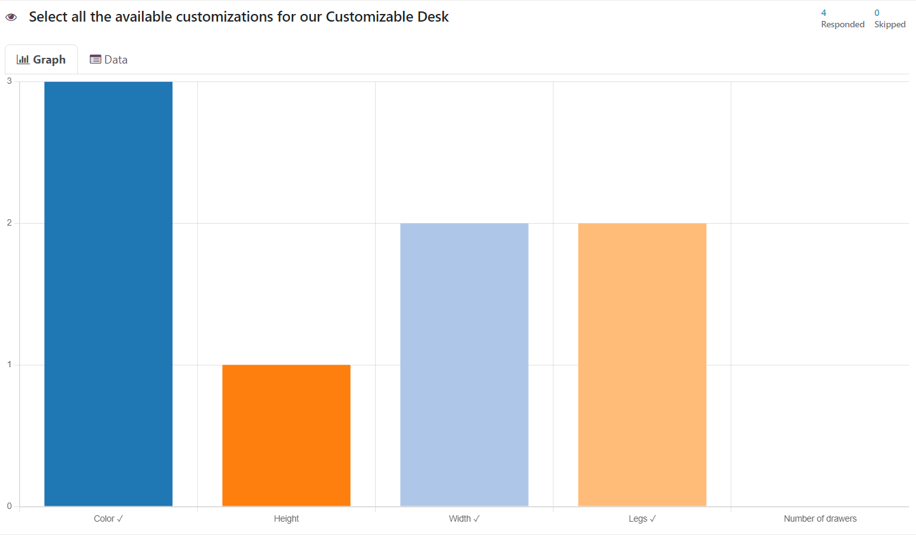
If there are multiple correct answer options (or no correct answers at all) for a multiple choice question, those results and responses are represented by a Bar Graph.
Each multiple choice question has a Graph tab and an Data tab. The graph-related tab is shown by default.
The Data tab shows all the provided Answer options for the question. The User Choice (with percentages and votes) along with the Score of each option.
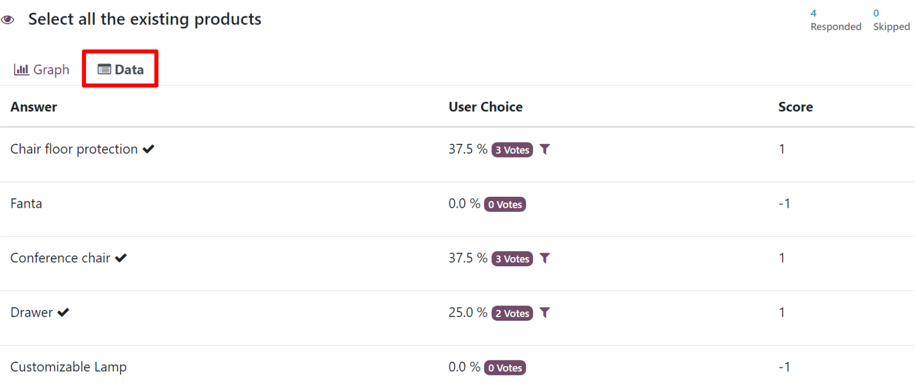
Other question types, wherein there were no answer options for the participant to choose from, there is a Most Common tab and an All Data tab.
The Most Common tab shows the User Responses, the Occurrence, and the Score (if applicable).
The All Data tab shows a list of all the submitted responses to that particular question.
If a question is looking for participants to enter a numerical value as a response, Maximum, Minimum, and Average indicators appear to the far-right of the results tabs.
A filter icon is also present either to the right of the User Choice column in a Data tab, or to the far-right of a User Response line in an All Data tab.
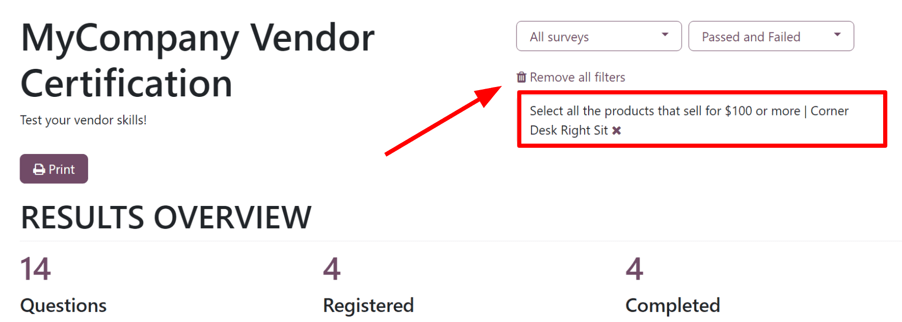
When that filter icon is clicked, Odoo returns the user to the top of the results page, with that chosen filter applied, showing the results of each question for participants who submitted that particular answer for that specific question.
Therefore, showcasing the remaining results for participants who answered that specific question in the same way. To remove that filter, and reveal all the results once again, click Remove all filters or click the ✖️ (X) icon in the filter box at the top of the results page.
参与人数
To view a consolidated list of participation results for a specific survey, navigate to Participations smart button at the top of the survey form.
, select the desired survey from the list, and click theDoing so reveals a separate Participations page, showcasing the participants for that specific survey, along with a collection of pertinent information related to each one.
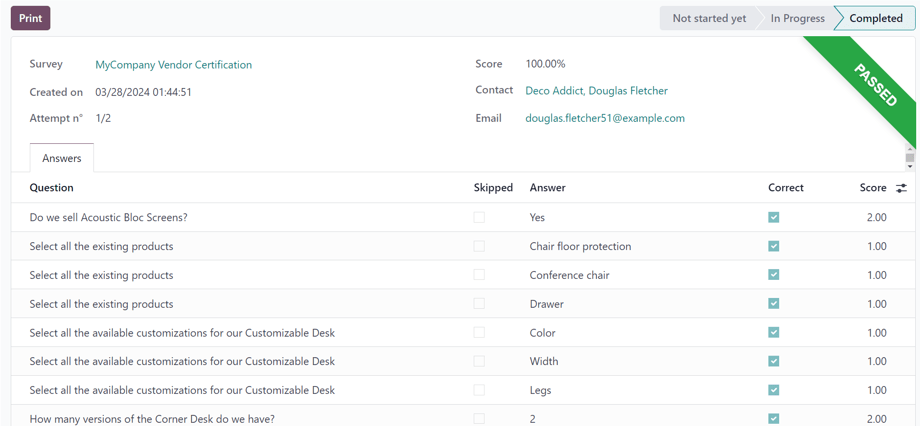
Here, users can view information related to individual participants who took that specific survey. If they desire to see a more detailed breakdown of their various answers and responses, they can click on any participant, and Odoo reveals a separate page showing that participant’s survey details, along with their submitted answers.
To view a consolidated list of all participants of every survey in the database, navigate to
. Here, every survey in the database is shown in a default nested list. Beside each survey title has the number of participants in parenthesis.When a survey is un-nested from this list, by clicking the survey title, the corresponding participants, along with their response-related data for that survey, appear on the page.
The Participations page can also be viewed in a Kanban layout, as well.
另请参阅