Purchase Analysis report
The Purchase Analysis report provides statistics about products purchased using Odoo’s Purchase app. This data is useful for gaining a deeper understanding of key metrics related to purchase orders (POs), including the quantity of products ordered and received, the amount of time it takes to receive purchased products, and more.
To open the Purchase Analysis report, navigate to
.重要
The Purchase Analysis report is one of many reports available across the Odoo app suite. This documentation only covers the measures specific to the Purchase Analysis report, along with a few use case examples.
For a full overview of the basic features available in most Odoo reports, see the documentation on reporting essentials.
度量
Measures refer to the various datasets that can be displayed on the Purchase Analysis report, with each dataset representing a key statistic about POs or products. To choose a measure, click the Measures button, and select one of the options from the drop-down menu:
# of Lines: The number of PO order lines, across all POs.
Average Cost: The average cost of POs.
Days to Confirm: The number of days it takes to confirm a PO.
Days to Receive: The number of days it takes to receive the products in a PO.
Gross Weight: The total weight of purchased products.
Qty Billed: The quantity of a product (or products) for which the vendor has already been billed.
Qty Ordered: The quantity of a product (or products) ordered.
Qty Received: The quantity of an ordered product (or products) received.
Qty to be Billed: The quantity of an ordered product (or products) for which the vendor has yet to be billed.
Total: The total amount spent, including tax.
Untaxed Total: The total amount spent, excluding tax. This measure is selected by default.
Volume: The total volume of ordered products, for products which are measured by volume.
Count: The total count of POs.
小技巧
Only one measure can be selected at a time when one of the (graph view) options is enabled. However, multiple measures, and varying group-by criteria (on the x and y axes), can be selected when using the (pivot table).
Use case: determine days to receive products from each vendor
One possible use case for the Purchase Analysis report is determining how long each vendor takes to deliver purchased items. This allows companies to make better informed decisions about which vendors they want to purchase from.
Example
A local bike shop, Bike Haus, sells high-quality unicycles, bicycles, tricycles, and all the accessories needed to ride and maintain them. They purchase their inventory from a few different vendors, and then sell those products on to customers through their storefront.
Recently, Bike Haus has decided to have their purchasing manager, David, look into how long it has taken each of their vendors to deliver the items they’ve purchased during the current year, 2024.
David starts by navigating to
, and selecting the (bar chart) graph type at the top of the report.Next, he clicks the (toggle) button on the right of the search bar to open its drop-down menu. In the Confirmation Date filter section, he makes sure that only the 2024 filter is enabled. Then, he selects the Vendor option in the Group By section, before clicking away from the drop-down menu to close it.
Finally, David clicks on the Measures drop-down menu, and selects the Days to Receive option.
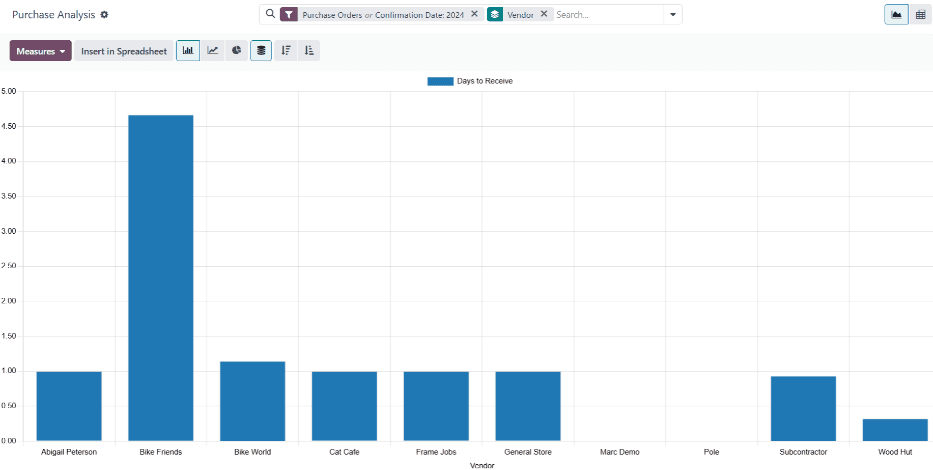
With all of these options enabled, the Purchase Analysis report shows a bar chart, with one bar for each vendor, representing the average number of days it takes to receive products purchased from the vendor.
Using this data, David can see that it takes Bike Friends over 4.5 days, on average, to deliver purchased products. This is more than four times the amount of time it takes any other vendor.
Based on these findings, David makes the decision to reduce the quantity of products purchased from Bike Friends.
Use case: compare vendor POs for two time periods
Another use for the Purchase Analysis report is to compare key statistics about POs for two different time periods, for a specific vendor. By doing so, it is easy to understand how purchases from the vendor have increased or decreased.
Example
Following the previous example, it has been one month since Bike Haus decided to reduce the quantity of products purchased from Bike Friends, one of their retailers. Bike Haus’ purchasing manager, David, wants to understand the impact this decision has had on the amount of money they have spent on Bike Friends products.
David starts by navigating to (pivot table) option at the top of the screen.
. Then, he selects theIn the search bar, he types Bike Friends
, and clicks Enter, so the report only
shows data for purchases from Bike Friends.
Then, David clicks the (toggle) button on the right of the search bar to open its drop-down menu. In the Confirmation Date field, he leaves the June and 2024 filters enabled. He also selects Confirmation Date: Previous Period in the Comparison section, before clicking away from the drop-down menu to close it.
Next, David clicks on the Measures drop-down menu. He leaves the Total and Untaxed Total datasets enabled, and disables the Order and Count datasets.
Finally, David clicks the Total button above the rows on the pivot table, and selects the Product option.
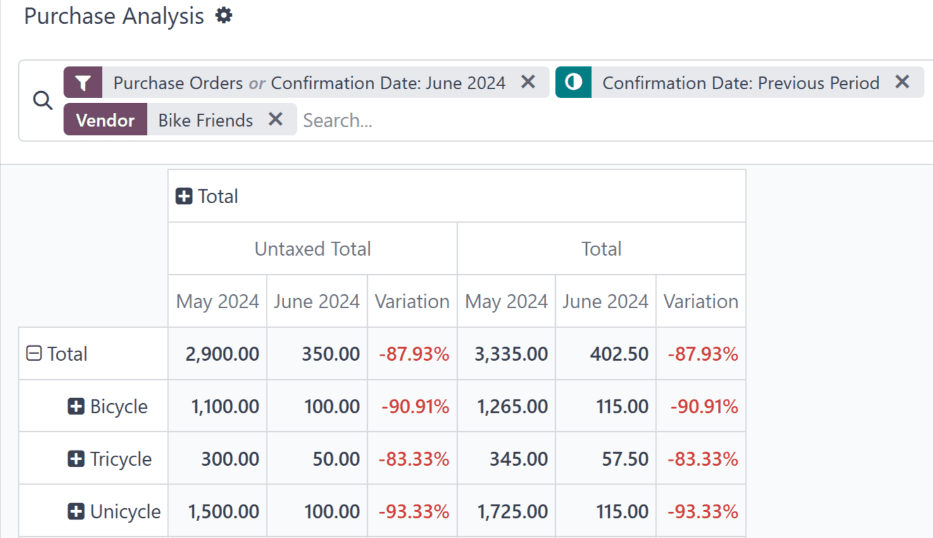
With all of these options configured, the Purchase Analysis report shows a pivot table comparing purchase data for the current month, June, with the previous month, May.
The pivot table is broken down into two main columns: one for the untaxed total spent, and one for the taxed total spent. These columns are further broken down into three smaller columns: the amount spent in May, the amount spent in June, and the variation between the two months, represented as a percentage.
On the left side of the pivot table, one row is shown for each product purchased from Bike Friends during June. Using this report, David is able to see that Bike Haus has spent much less money on products purchased from Bike Friends, compared to the previous month.