Members analysis
The Members Analysis report provides a detailed overview of all memberships sold and managed
within the Members application.
To access the Memberships Analysis report, navigate to .
Navigate the report
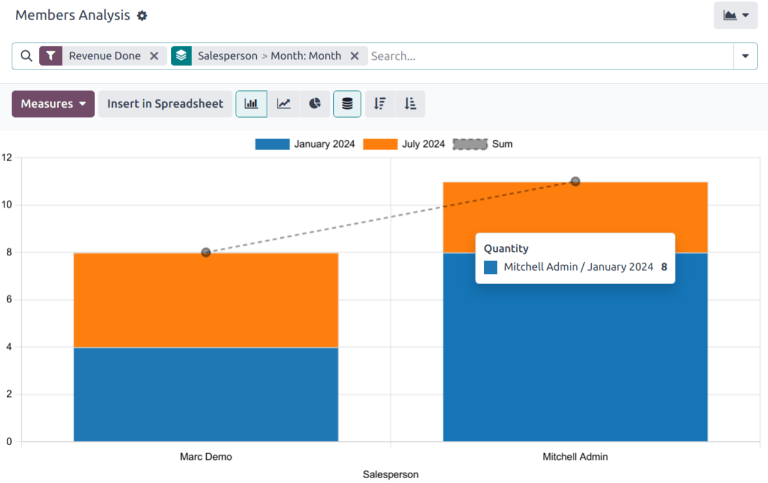
The default Members Analysis report displays a bar chart, measuring the Quantity of
memberships against the amount of Revenue Done. The data is grouped by the assigned
salesperson, then by the month the membership begins.
Additional Group By options include the following:
Salesperson: the internal user in charge of the contact. This information is managed
in the Salesperson field on the Sales & Purchase tab on the contact’s record.
Associated Partner: the contact listed as the Associated Member on the Membership
tab on the contact’s record.
Membership Product: the type of membership assigned to a contact. This includes both
purchased memberships and free memberships.
Current Membership State: the status of the membership.
Company: the company the membership is purchased through. This option only appears in
multi-company databases.
Month: the month the membership began.
View results
Click the (graph) icon to change to graph view. Then, click the
corresponding icon at the top of the report to switch to a (bar
chart), (line chart), or (pie
chart).
Click the (pivot) icon to change to the pivot view.
小技巧
The pivot view can be used to view and analyze data in a more
in-depth manner. Multiple measures can be selected, and data can be viewed by month, and by
opportunity stage.