Work entry analysis
The default Work Entries Analysis report provides an overview of the validated work entries for the current month. To view this report, navigate to .
The work entries appear in a pivot table, with the default filters of Current month: (Month)(Year) and Validated. The various types of Work entries populate the rows, while the Total values populate the only visible column.
To change the displayed information, click Total above the main column, revealing a drop-down menu of available metrics. Click on one of the available groupings, and the data is further organized by that selected metric. The default options are Work Entry Type, Employee, and Department. If in a multi-company database, a Company option also appears.
Work entry analysis comparison
It is possible to compare the work entries from one time period to a previous time period. To view this comparison, first navigate to .
Next, click the (down arrow) icon in the search bar, revealing a drop-down menu. Under the Comparison section, click on either Current Month: Previous Period or Current Month: Previous Year.
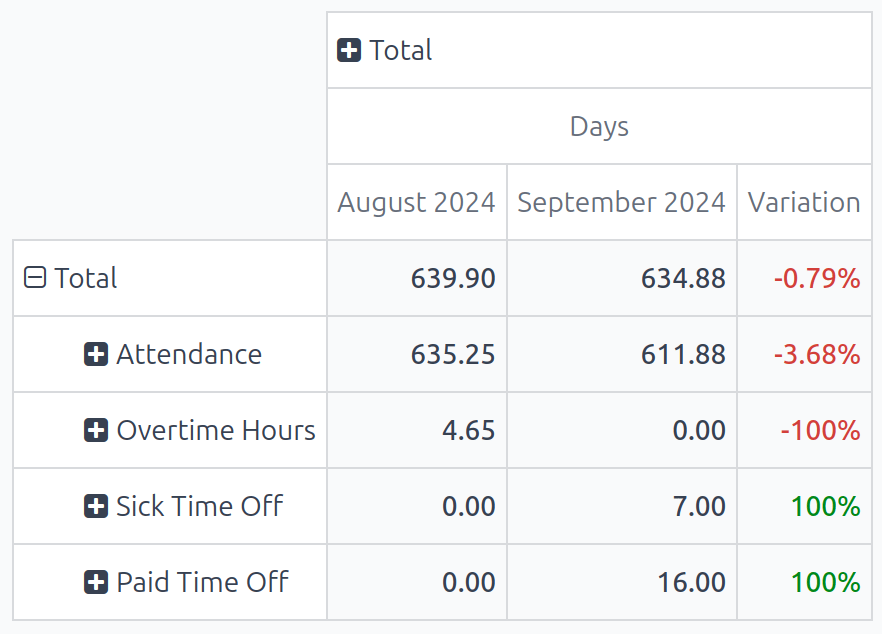
The report updates and displays the data for the current time period, data for the selected previous time period, as well as the Variation between the two, in a percentage.

Note
If no work entries for a specific work entry type are logged for the time period, it does not appear on the report. That does not mean the work entry type does not exist, or is not configured.
Additionally, if the default Current month: (Month)(Year) filter is removed from the search bar, the Comparison column does not appear; there must be a time-frame selected to view the Comparison column.
Use case: overtime report comparison
It is possible to alter the Work Entries Analysis report to show a comparison of only overtime work entries, grouped by employee, for a specific time period. To view this data, first navigate to the default Work entry analysis report by going to .
Next, click the (down arrow) icon in the search bar, revealing a drop-down menu. Under the Filters column, click Add Custom Filter, and a Add Custom Filter pop-up window appears.
Using the drop-down menu, select Work Entry Type for the first field, leave the middle field as-is (with is in populating the field), and select Overtime Hours for the last field. Click Add, and all other work entry types disappear, and Overtime Hours appear in the sole row.
To compare overtime from the current month to the previous month, to see which month had more overtime logged, click the (down arrow) icon again in the search bar. Under the Comparison section, click Current Month: Previous Period. Click away from the drop-down menu to close it.
Now, the report displays the Overtime Hours for the current month and the previous month, along with the Variation, in a percentage.
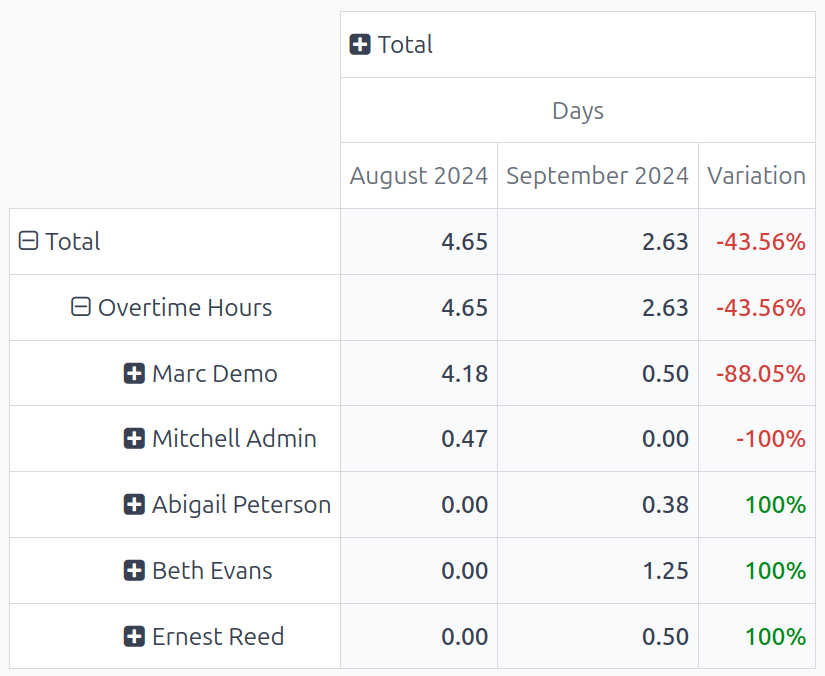
To view which employees received the most overtime, click Overtime Hours, revealing a drop-down menu of options. Click Employee, and all employees with overtime work entries for either the current or previous month appears.
In this example, it can be determined that Marc Demo worked the most overtime in August 2024, whereas Beth Evans worked the most overtime hours in September 2024. Additionally, Mitchell Admin had the largest variation change, with a -100% change from August 2024 to September 2024.
